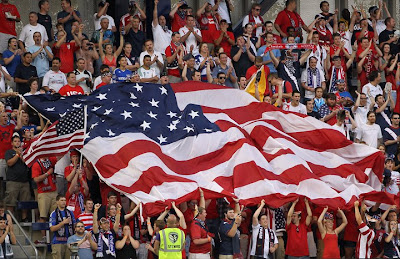
Monday, June 27, 2011

Week 15 Attendance Update

Team Attendance Capacity Percent Full Percent Change Since 2010
Chicago Fire 14,026 20,000 70.13% -11.30%
Chivas USA 15,334 27,000 56.79% 5.21%
Colorado Rapids 14,258 19,680 72.45% 6.98%
Columbus Crew 10,483 20,455 51.25% -28.40%
DC United 15,557 45,596 34.12% 7.06%
FC Dallas 12,808 21,193 60.44%
18.43%
Houston Dynamo 17,198 32,350 53.16% -0.64%
Los Angeles Galaxy 22,206 27,000 82.24% 3.59%
New England Revolution 12,008 22,385 53.64% -7.53%
New York Red Bulls 18,204 25,189 72.27% -1.29%
Philadelphia Union 18,177 18,500 98.25% -5.60%
Portland Timbers 18,627 18,627 100.0% ---
Real Salt Lake 16,057 20,008 80.25% -6.07%
San Jose Earthquakes 9,909 10,300 96.21% 2.59%
Seattle Sounders 37,264 35,700 104.38% 3.02%
Sporting Kansas City 18,953 18,467 102.63% 84.24%
Toronto FC 19,882 23,000 86.44% -2.79%
Vancouver Whitecaps 19,618 20,000 98.09% ---
Average 17,400 23,636 73.61% 4.35%

The attendance for the Gold Cup Final at the Rose Bowl was 93,420. 
As most of you know, Mexico won 4-2.

Tuesday, June 21, 2011

Week 14 Attendance Update

Team Attendance Capacity Percent Full Percent Change Since 2010
Chicago Fire 13,380 20,000 66.90% -15.39%
Chivas USA 15,334 27,000 56.79% 5.21%
Colorado Rapids 14,258 19,680 72.45% 6.98%
Columbus Crew 10,447 20,455 51.07% -28.65%
DC United 15,535 45,596 34.07% 6.91%
FC Dallas 13,100 21,193 61.81% 21.13%
Houston Dynamo 17,198 32,350 53.16% -0.64%
Los Angeles Galaxy 22,206 27,000 82.24% 3.59%
New England Revolution 12,008 22,385 53.64% -7.53%
New York Red Bulls 18,204 25,189 72.27% -1.29%
Philadelphia Union 18,189 18,500 98.32% -5.53%
Portland Timbers 18,627 18,627 100.0% ---
Real Salt Lake 16,196 20,008 80.95% -5.26%
San Jose Earthquakes 9,772 10,300 94.87% 1.17%
Seattle Sounders 36,296 35,700 101.67% 0.34%
Sporting Kansas City 19,196 18,467 103.95% 86.60%
Toronto FC 19,882 23,000 86.44% -2.79%
Vancouver Whitecaps 19,618 20,000 98.09% ---
Average 17,232 23,636 73.33% 3.34%

Wednesday, June 15, 2011

USMNT and What YOU Want!!

It was nice to see new Livestrong Sporting Park overflowing with an official attendance of 20,109. The official capacity of LSP is 18,467 so it is nice to see that they packed them in. The USMNT had less than stellar attendance in Detroit and Tampa Bay with attendances of 28,209 and 27,731 respectively in stadiums that hold 60,000+. For two places hoping for an MLS team, this was less than hopeful. I am hoping that the USMNT can bring it together and start finishing along with playing well. 
Meanwhile, Group B had attendances of 21,507, 18,067, and 25,000 in a group with no large country to headline the group. Group A had amazing attendance with Mexico in the group with sessions with attendance of 80,108, 46,012, and 62,000. 

The knockout stages should have higher attendance with more weight on each game and all the large countries headlining each session. The question is, will the US be able to make it to the Rose Bowl to play in a final which almost inevitably will feature a Mexico team that has yet to face a challenge.
Finally, I have asked this before with no response, but as there is a constant amount of reader base and followers, I am wondering what teams you follow and which teams would you like a game by game breakdown. I have noticed a lot of activity from LA, Seattle, Portland, and the NYC area, but please comment if you would like a team update more often then once or twice a year. Otherwise I will continue with a weekly update of the attendance of each team in the normal table breakdown.

Thanks for continuing to view this website, and post and comments or suggestions so I can help to make this more informative to you, the reader

Tuesday, June 14, 2011

Week 13 Attendance Update

Team Attendance Capacity Percent Full Percent Change Since 2010
Chicago Fire 13,380 20,000 66.90% -15.39%
Chivas USA 15,917 27,000 58.95% 9.21%
Colorado Rapids 13,684 19,680 69.53% 2.67%
Columbus Crew 10,447 20,455 51.07% -28.65%
DC United 15,535 45,596 34.07% 6.91%
FC Dallas 13,100 21,193 61.81% 21.13%
Houston Dynamo 17,718 32,350 54.77% 2.37%
Los Angeles Galaxy 22,206 27,000 82.24% 3.59%
New England Revolution 12,449 22,385 55.62% -4.13%
New York Red Bulls 18,204 25,189 72.27% -1.29%
Philadelphia Union 18,189 18,500 98.32% -5.38%
Portland Timbers 18,627 18,627 100.0% ---
Real Salt Lake 16,089 20,008 80.41% -5.88%
San Jose Earthquakes 9,772 10,300 94.87% 1.17%
Seattle Sounders 36,296 35,700 101.67% 0.34%
Sporting Kansas City 19,925 18,500 107.90% 93.69%
Toronto FC 19,665 23,000 85.50% -3.85%
Vancouver Whitecaps 19,550 20,000 97.75% ---
Average 17,333 23,636 73.33% 3.95%

Sunday, June 5, 2011

Week 12 Attendance Update

Team Attendance Capacity Percent Full Percent Change Since 2010
Chicago Fire 13,380 20,000 66.90% -15.39%
Chivas USA 15,917 27,000 58.95% 9.21%
Colorado Rapids 13,684 19,680 69.53% 2.67%
Columbus Crew 10,071 20,455 49.24% -31.21%
DC United 15,739 45,596 34.52% 8.31%
FC Dallas 13,479 21,193 63.60% 24.63%
Houston Dynamo 17,488 32,350 54.06% 1.03%
Los Angeles Galaxy 22,425 27,000 83.06% 4.61%
New England Revolution 12,449 22,385 55.62% -4.13%
New York Red Bulls 17,776 25,189 70.57% -3.61%
Philadelphia Union 18,099 18,500 97.83% -6.00%
Portland Timbers 18,627 18,627 100.0% ---
Real Salt Lake 16,089 20,008 80.41% -5.88%
San Jose Earthquakes 9,772 10,300 94.87% 1.17%
Seattle Sounders 36,266 35,700 101.59% 0.26%
Sporting Kansas City
18,500

Toronto FC 19,665 23,000 85.50% -3.85%
Vancouver Whitecaps 19,550 20,000 97.75% ---
Average 17,230 23,636 72.90% 3.33%